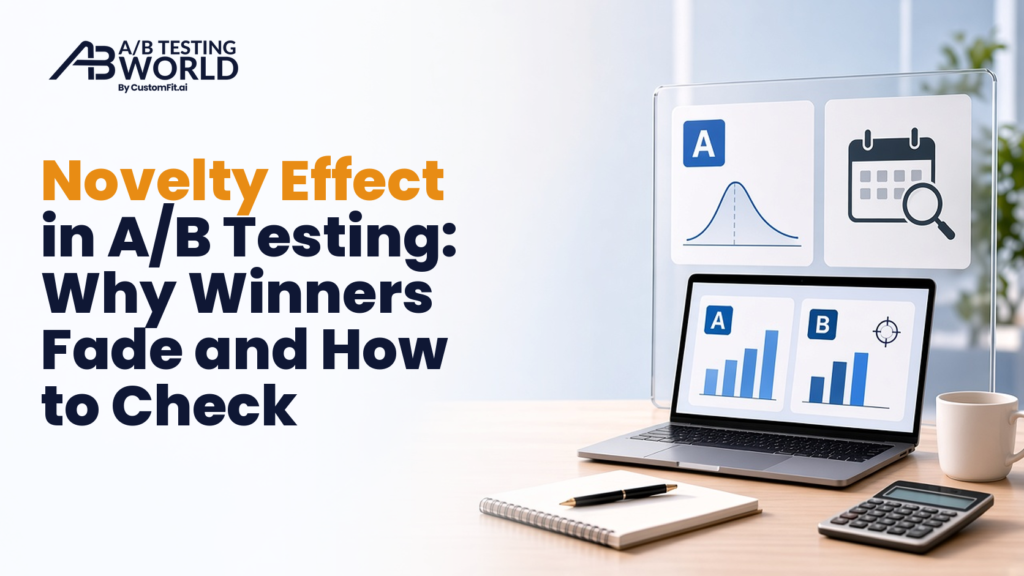
Novelty effect AB testing problems tend to look the same: a test wins in week one and fades by week four. Before you trust any early result, it helps to know how long an A/B test should run. Testing tools report an average lift across the whole test, and that average can hide a spike that is already fading.
This novelty effect AB testing guide covers the full picture. You will learn what the novelty and primacy effects are, how to spot them with two charts, why the winner’s curse shrinks big wins after launch, and how to size up a result before rollout.
What Is the Novelty Effect in AB Testing?
The novelty effect is a short-term lift caused by the change being new, not by the change being better. Spotting it is the whole point of novelty effect AB testing checks. Returning visitors notice something different, they click on it out of curiosity, and for a week or two the variant looks like a clear winner. Once the change becomes familiar, behavior drifts back toward the old baseline.
Here is a typical ecommerce case. A skincare store adds a bright “Complete your routine” bundle widget under the add-to-cart button. In the first seven days, add-to-cart rate on the variant is 14% higher than control. By day 28 the gap has dropped to about 2%. The widget did not stop working. Most of the early lift came from regular customers poking at something they had never seen before.
Novelty effect AB testing problems are most common when:
- A large share of traffic is returning visitors or logged-in customers.
- The change is visual and easy to notice, such as a new badge, color, animation or layout.
- The test is read after only one or two weeks.
- The metric is an engagement signal, like clicks on the new element, rather than orders.
What Is the Primacy Effect in AB Testing?
The primacy effect is the mirror image. Returning users are used to the old design, so a change slows them down at first, even if it is better in the long run. A redesigned navigation menu is the classic example. Loyal shoppers look for the old “Shop by concern” link, cannot find it, and some leave. The variant starts behind, often by 3% to 5%, and only pulls ahead once people learn the new layout.
Primacy effect AB testing mistakes are costly because teams kill good ideas early. If you stop a navigation test after nine days because it is losing by 4%, you may never see it finish at plus 3%. The psychology behind this is covered in our post on how small changes affect user behavior.
Novelty Effect A/B Testing Checks: Two Charts That Reveal It
You do not need special software for novelty effect AB testing checks. Test data exported to a spreadsheet is enough to build two charts.
Chart 1: Day-by-day lift
Plot the daily lift of the variant over control, not the running total. Running totals smooth everything out and make an early spike look like a stable result. Daily lift shows the shape. A novelty effect looks like a ski slope: high at the start, falling steadily, then flattening. A primacy effect looks like the opposite, starting low and rising.
Daily numbers are noisy, so use a seven-day rolling average, which also removes the weekend swing.
Chart 2: Lift by exposure cohort
This chart is more reliable. Group users by the day they first saw the test, then compare the lift for each cohort on their first day, their seventh day and so on. If people who entered in week three show a smaller first-day lift than people who entered in week one, something outside the test changed. If every cohort shows a big lift on day one that shrinks by day seven, that is the novelty effect in its clearest form.
A quicker version is to split results by new and returning visitors. New visitors have no memory of the old design, so they cannot be surprised by the change. If the lift for new visitors is steady and the lift for returning visitors is large but falling, you have your answer. The CustomFit.ai team explains this split in its guide to segmenting A/B test results.
Here is the skincare bundle test split this way. It is a textbook novelty effect AB testing result:
| Week | New visitors lift | Returning visitors lift | Blended lift |
| Week 1 | 2.4% | 26.1% | 14.0% |
| Week 2 | 2.1% | 11.8% | 6.5% |
| Week 3 | 2.6% | 4.9% | 3.4% |
| Week 4 | 2.2% | 2.0% | 2.1% |
New visitors gave roughly 2.3% from start to finish. That is the real, lasting effect. Returning visitors created a 26% spike that faded to the same level within a month.
Read more: A/B Test Sample Size: Formula, Worked Examples & Tables
The Winner’s Curse in AB Testing
Even when novelty effect AB testing checks come back clean, winning tests tend to look better than they really are. This is called the winner’s curse, and it is a statistical problem, not a behavioral one.
Every test result is the true effect plus some random noise. When you only ship tests that cross the significance line, you mostly ship the ones where noise pushed the number up. The tests where noise pushed it down never get declared winners, so you never see them. On average, the winners you do ship carry a lucky boost that will not repeat after launch.
How large is that boost? It depends on power. Statisticians Andrew Gelman and John Carlin call this a Type M, or magnitude, error in their paper on Type S and Type M errors. We ran a quick simulation using the standard 95% significance threshold, and the average significant result overstated the true effect by:
- About 12% when the test had 80% power.
- About 41% when the test had 50% power.
- About 2.25 times when the test had only 20% power.
So a 20% lift from an underpowered test on a small store might really be closer to 9%. Winner’s curse AB testing errors are why so many teams see a big win in the report and a much smaller change in revenue a quarter later. Planning tests around a realistic minimum detectable effect keeps power high and the curse small.
Test Changes That Hold Up After Launch
Run product page and checkout experiments without code, then read the results by new and returning visitors. Use every CustomFit.ai feature free for 14 days.
How to Measure Long-Term Effects of AB Tests
Short tests tell you whether people reacted. The long-term effects of AB tests tell you whether the change kept working. Here are three ways to check.
Run long enough to see the curve flatten
Most tests should run at least two full weeks, and changes that returning customers will notice should run three to four. Watch the day-by-day lift. When the rolling average stops falling for about a week, the novelty effect has probably worn off. If it is still dropping when you hit your planned sample size, extend the test rather than calling it early.
Keep a holdout after rollout
After you ship a winner, keep 5% to 10% of traffic on the old version for another 30 to 60 days. It is the most reliable novelty effect AB testing control, because it gives a clean read once the novelty is gone. The CustomFit.ai team covers sizing and setup in its guide to holdout groups in experimentation.
Google used long-running holdouts on search ads and found that user behavior kept changing for months after a change went live. Their paper, Focus on the Long-Term: It’s Better for Users and Business, is worth reading if your store sells to repeat buyers.
Measure a metric that reflects real value
Clicks on a new widget are almost guaranteed to spike. Orders, revenue per visitor and repeat purchase rate are much harder to fool. Pair a primary metric with guardrails so a flashy click lift cannot pass for a real win.
How to Size Up a Win Before Rollout
Before you announce a result, run it through a short review. These five questions take about twenty minutes and catch most fake winners.
- 1. Is the lift stable over time? Look at the last seven days of daily lift, not the full-test average. If the recent number is half the headline number, report the recent one.
- 2. Do new visitors show the same lift? This is the fastest novelty effect AB testing check. If new visitors are flat and returning visitors drive the whole result, expect the win to fade.
- 3. How much power did the test have? If a test planned for a 20% MDE barely clears significance with a 14% lift, treat 10% as a more realistic forecast.
- 4. Does the result make sense? A small copy change that lifts orders by 30% is far more likely to be noise or a tracking bug than a breakthrough.
- 5. Can you confirm it? For pricing, checkout or navigation changes, rerun the test or keep a holdout. The CustomFit.ai checklist on how to double-check an A/B test winner before scaling covers this step in more depth.
Novelty Effect AB Testing Checklist Before Rollout
- Plan for at least two full weeks, and three to four for highly visible changes.
- Chart daily lift with a seven-day rolling average.
- Split the results by new and returning visitors.
- Judge the test on orders or revenue per visitor. Clicks on the shiny new element will flatter it.
- Discount large wins from low-power tests to allow for the winner’s curse.
- Keep a 5% to 10% holdout for 30 to 60 days after rollout on high-impact changes.
- Write down the forecast lift, then compare it with the holdout result later.
Find the Wins That Last
Start with one high-traffic page and a test you can run for three full weeks. Try CustomFit.ai free for 14 days, no credit card required.
Summary
A novelty effect is a temporary lift that appears because a change is new, and a primacy effect is a temporary drop that appears because people are used to the old version. Both fade with time, so the first week of a test rarely tells the full story. Good novelty effect AB testing practice means charting daily lift, splitting by new and returning visitors, and running long enough for the curve to flatten. Then allow for the winner’s curse by trimming large wins from low-power tests, and keep a holdout to measure the long-term effect.
FAQs
What is the novelty effect in A/B testing?
It’s a short bump you get because shoppers notice something new on the page, and that bump says little about whether the change is actually better. Returning visitors interact with it out of curiosity, so the variant looks strong early on. As the change becomes familiar, the lift shrinks, often to a fraction of the first-week number.
How do you detect a novelty effect in an A/B test?
The simplest novelty effect AB testing method is to plot the daily lift with a seven-day rolling average and look for a line that starts high and falls steadily. Then split the results by new and returning visitors. If returning visitors drive a large but shrinking lift while new visitors show a small, steady one, a novelty effect is the likely cause.
What is the difference between the novelty effect and the primacy effect?
They move in opposite directions. With novelty, the early numbers look too good, since people poke at whatever just changed. With primacy it runs the other way: regulars know the old layout by heart, so the new one looks worse until they get used to it. Both effects fade, so neither should decide a test on its own.
What is the winner’s curse in A/B testing?
The winner’s curse is the tendency for winning tests to overstate the true effect. Because only results that cross the significance threshold get shipped, the ones you ship usually include a lucky dose of noise. At 80% power the overstatement averages about 12%, but at 50% power it is closer to 40%.
How long should you run an A/B test to avoid the novelty effect?
For novelty effect AB testing, run most tests for at least two full weeks, and run tests of highly visible changes for three to four weeks. Keep going until the rolling daily lift has been roughly flat for about seven days. For high-impact changes, keep a small holdout after rollout to measure the long-term effects of AB tests.