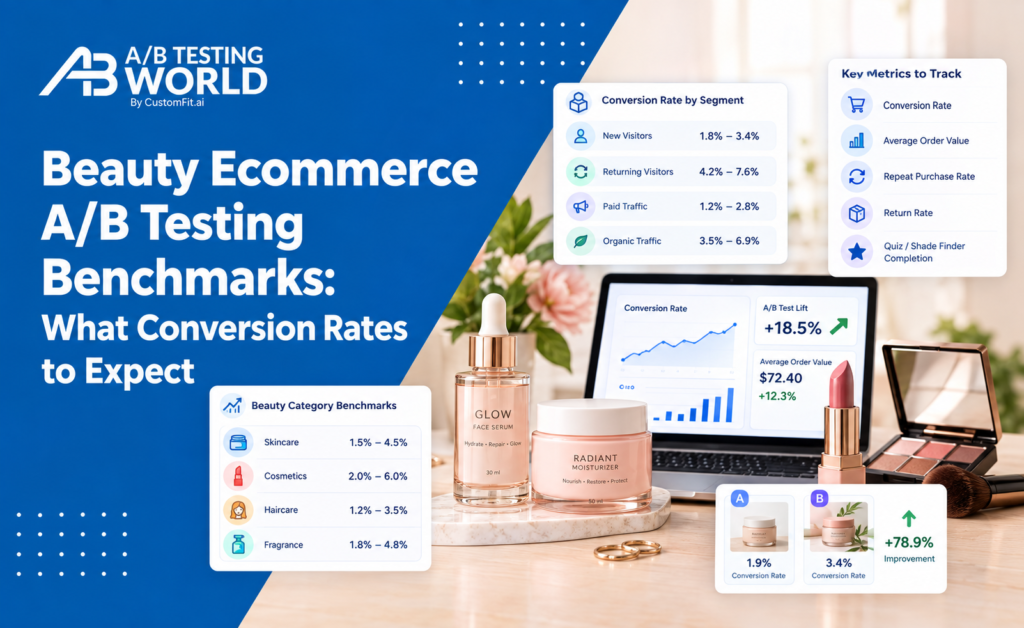
One of the first questions every beauty brand asks once they start testing is some version of “is our conversion rate actually good?” It’s a reasonable question, and also a harder one to answer precisely than most benchmark articles let on. Beauty ecommerce conversion rate benchmarks vary meaningfully by price point, product type, traffic source, and whether you’re looking at new versus returning visitors — a single headline number flattens all of that away.
This isn’t a list of exact figures to chase. It’s a guide to using benchmarks the way they’re actually useful: as a sanity check and a rough calibration point, not a scoreboard.
Why beauty benchmarks are harder to pin down than other categories
Beauty spans an unusually wide range of price points and purchase types in one category label — a $12 lip balm and a $180 serum are both “beauty,” but they convert under completely different psychological conditions. Impulse-priced items convert closer to how a typical FMCG product does; higher-priced, more considered skincare purchases behave more like a smaller-ticket considered purchase in another category entirely. Any single “beauty industry average” number is quietly averaging across products that don’t actually behave the same way.
Skincare industry conversion rate: what actually drives the range
A few factors explain most of the spread you’ll see across different beauty brands’ conversion rates, more than any inherent difference in how “good” their sites are:
Traffic source mix. A brand driving mostly paid social traffic to cold audiences will show a meaningfully lower conversion rate than one relying heavily on returning customers and email traffic, regardless of how well-optimized either site actually is.
New-to-brand skepticism. Skincare specifically carries real trust barriers — allergic reaction concerns, ingredient sensitivity, uncertainty about whether a formula will actually work for a specific skin type. First-time visitor conversion rates in this category tend to run meaningfully below returning customer rates, more so than in lower-risk categories.
Price point and consideration level. Lower-priced, lower-commitment products (a basic moisturizer) convert at different rates than higher-priced, higher-stakes purchases (a full skincare system or a premium anti-aging serum), even within the same brand’s catalog.
Read Also: A/B Testing for Health & Wellness Brands on Shopify
Beauty brand A/B test benchmarks: using the numbers correctly
1. Benchmark against your own historical performance first. The most useful comparison isn’t your site against an industry average pulled from a mix of brands with different price points and traffic sources — it’s your site this quarter against your site last quarter, controlling for the same traffic mix.
2. Segment any external benchmark by similar traffic source and price point before comparing. A broad “ecommerce average conversion rate” figure that doesn’t specify beauty, price range, or traffic composition isn’t a meaningful comparison point for a premium skincare brand running primarily paid acquisition.
3. Treat a lift from a test as more reliable evidence than a comparison to an external benchmark. A 15% relative lift from a controlled A/B test on your own traffic tells you something real and specific. A gap between your conversion rate and an industry average figure could be explained by dozens of factors that have nothing to do with your site’s actual quality.
Cosmetics ecommerce KPI: metrics worth tracking alongside conversion rate
Conversion rate alone tells an incomplete story for beauty specifically, given how much repeat purchase and routine-building matters to the category’s economics:
- Average order value, since bundling and routine-based purchasing is common in beauty and can matter more to overall revenue than raw conversion rate alone
- Repeat purchase rate and time between repurchases, especially for consumable skincare products with a natural reorder cycle
- Return and complaint rate tied to specific products, which can reveal a shade-matching or formula-expectation problem that conversion rate alone won’t surface
- Quiz or shade-finder completion rate, if you use a guided selling tool, as a leading indicator of whether that tool is actually reducing the friction it’s meant to address
Average beauty store conversion rate: a realistic way to think about it
Rather than chasing a specific percentage pulled from a generic industry report, it’s more useful to establish your own realistic range by segment — new vs. returning visitors, paid vs. organic traffic, and by price tier within your own catalog. Track those segmented rates over time, and use A/B testing to move each one upward within its own context, rather than comparing your blended average against a number that was never calculated the same way your site’s traffic actually breaks down.
Common mistakes when benchmarking beauty conversion rates
The most common mistake is comparing a blended, site-wide conversion rate against a generic “ecommerce average” or “beauty industry average” figure without accounting for traffic source or price point differences, leading to either false alarm or false confidence. The second is treating benchmarks as a target to hit rather than a rough calibration tool — a brand genuinely performing well relative to its own specific traffic and price point shouldn’t panic over falling short of a generic number that was never a fair comparison in the first place.
The bottom line
Beauty ecommerce conversion rate benchmarks are useful as a loose sanity check, not a precise scoreboard — the category’s wide range of price points and the unusually high trust barrier in skincare specifically make any single number a poor fit for most individual brands. The more productive approach is tracking your own segmented rates over time and using controlled A/B testing, rather than external benchmarks, as your primary measure of real progress.